- Published on
CloudWatch + ElasticSearch + Cognito
- Authors

- Name
- Linell Bonnette
A bug appeared recently in a very important service that was impossible to debug without the ability to query and trace through the service's CloudWatch logs. I decided that a great solution would be to stream the CloudWatch logs into Kibana in Amazon's Elasticsearch Service. Setting this up all up ended up being an easy process with a huge payoff.
I'm going to guide you though a completely fresh run of setting this up for the service that's powering What's My Temp Again. It's a Lambda service sending logs to CloudWatch, so those are the examples I'll be using going forward. Anything logged to CloudWatch should work exactly the same, though.
ElasticSearch Service
The first step is to log in to your AWS console and navigate to the Elasticsearch Service. Once you're there you'll go ahead and click "Create a new domain", which does exactly what it sounds like and fires up a wizard for creating a new Elasticsearch domain.
The first screen is just a name for the domain, I used wmta-logs, and an ElasticSearch version number, for which I just selected the latest (6.3). The next screen actually configures the ES cluster itself. For this example I'm going to just leave the defaults for everything on this page and then hit next.
The next page was, for me, the biggest hurdle of the whole setup. I want to be able to access these logs easily from anywhere but I don't want just anybody to be able to see all of my logs. To set this access up, I selected "Public access" in the "Network configuration" section. What we are going to do is select the checkbox under "Kibana authentication", which is going to take us on a trip into the world of Cognito.
We're going to have to create a Cognito User Pool and a Cognito Identity Pool, which will be used to control authentication. To get started, all you've got to do is click the "Enable Amazon Cognito for authentication" button.
You've now got the option to select or create a user pool, identity pool, IAM role name, and role policy. If you've already got everything you need for Cognito, you can just select those and continue down the page a little ways. Otherwise, go ahead and click "Create new user pool". A new tab will open in which you're guided through creating a user pool.
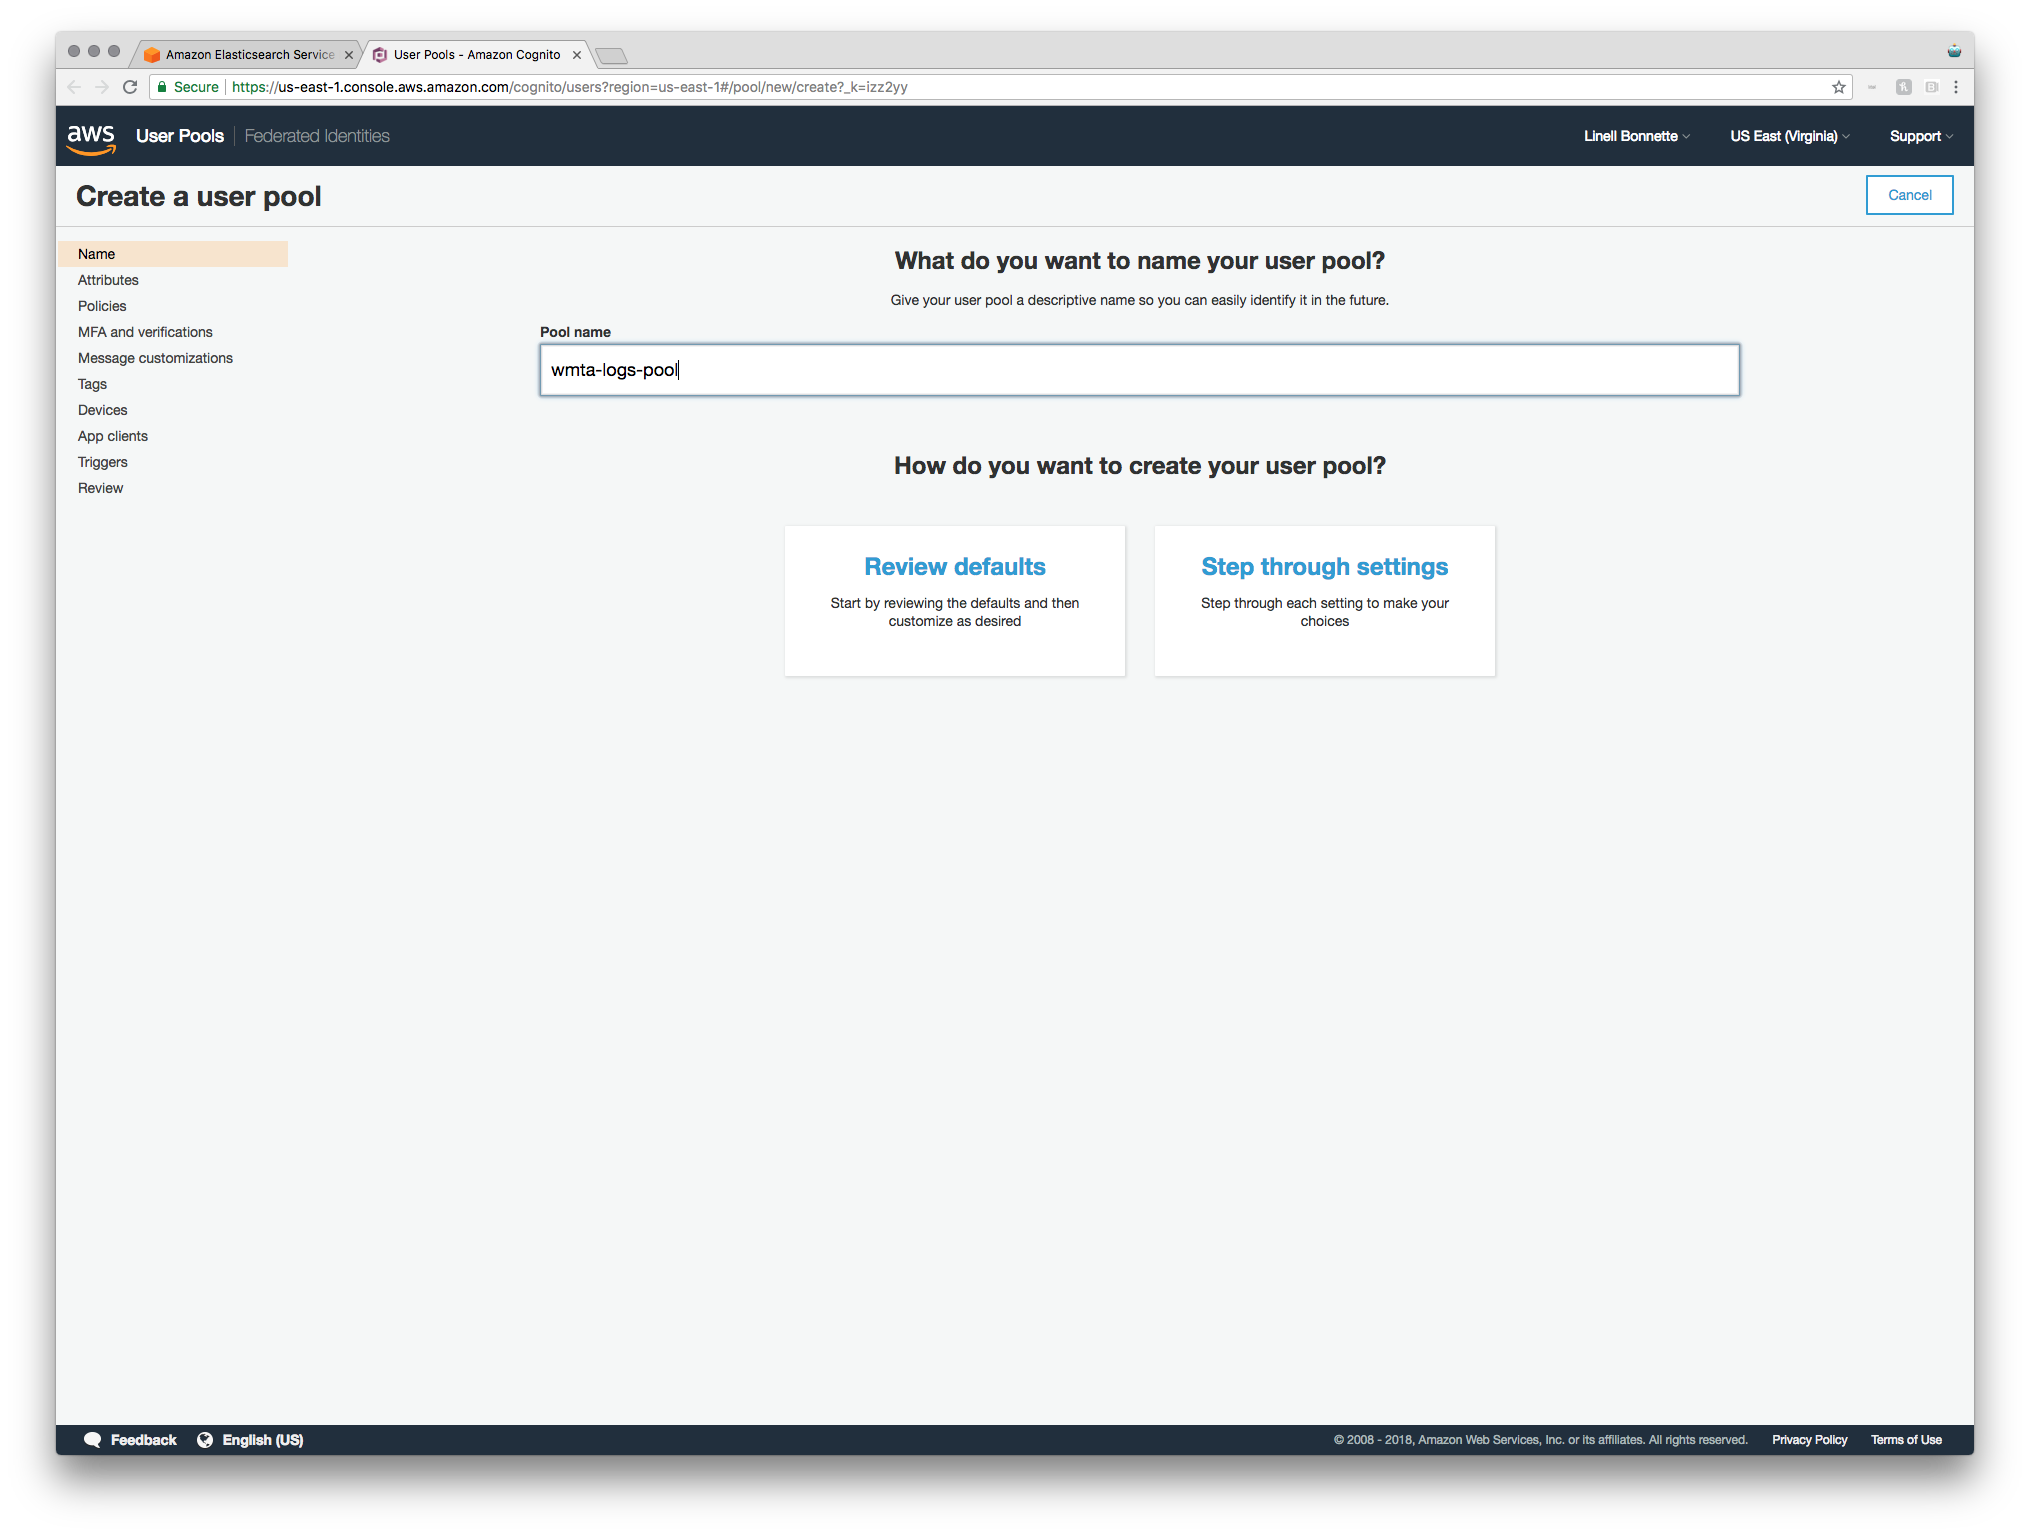
User Pool Setup
After filling out your pool name (I went with wmta-logs-pool), click "Step through settings." There are just a few things we need to tweak to make this work like we need.
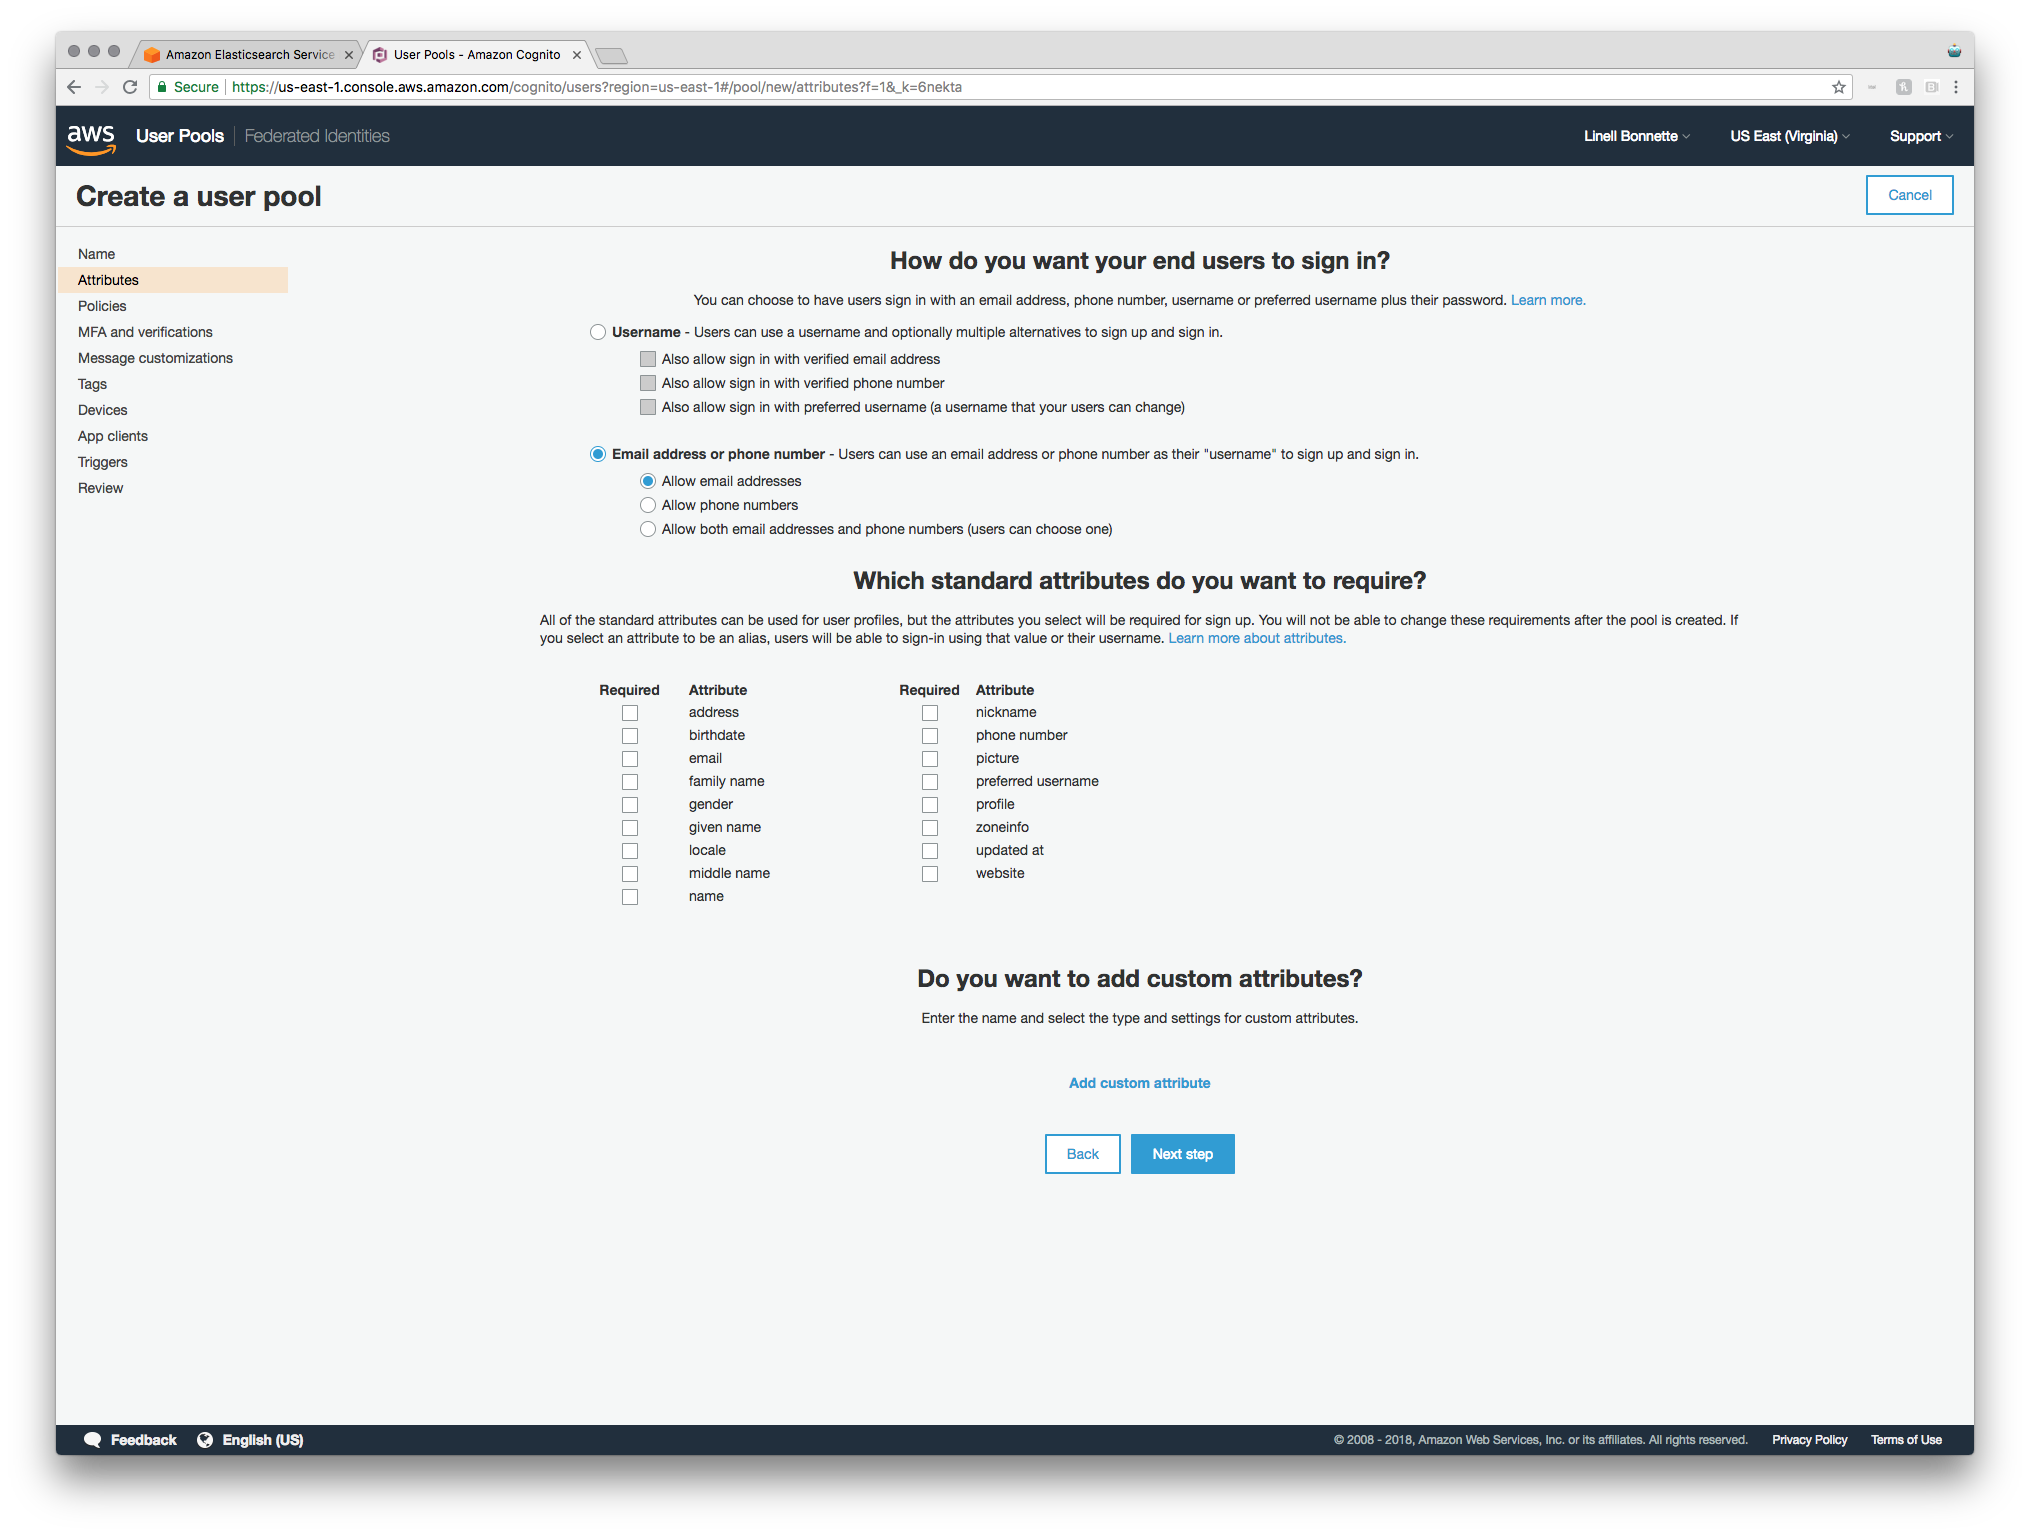
The first step is setting up how you want your end users to sign in. For our use case, our "end users" are actually employees looking at logs. For me, it makes sense for this to just be the employee's email address and I don't need any other standard attributes.
On the next page you configure the minimum password strength, whether or not users can sign themselves up, and how quickly accounts created by admins should expire if they aren't used.
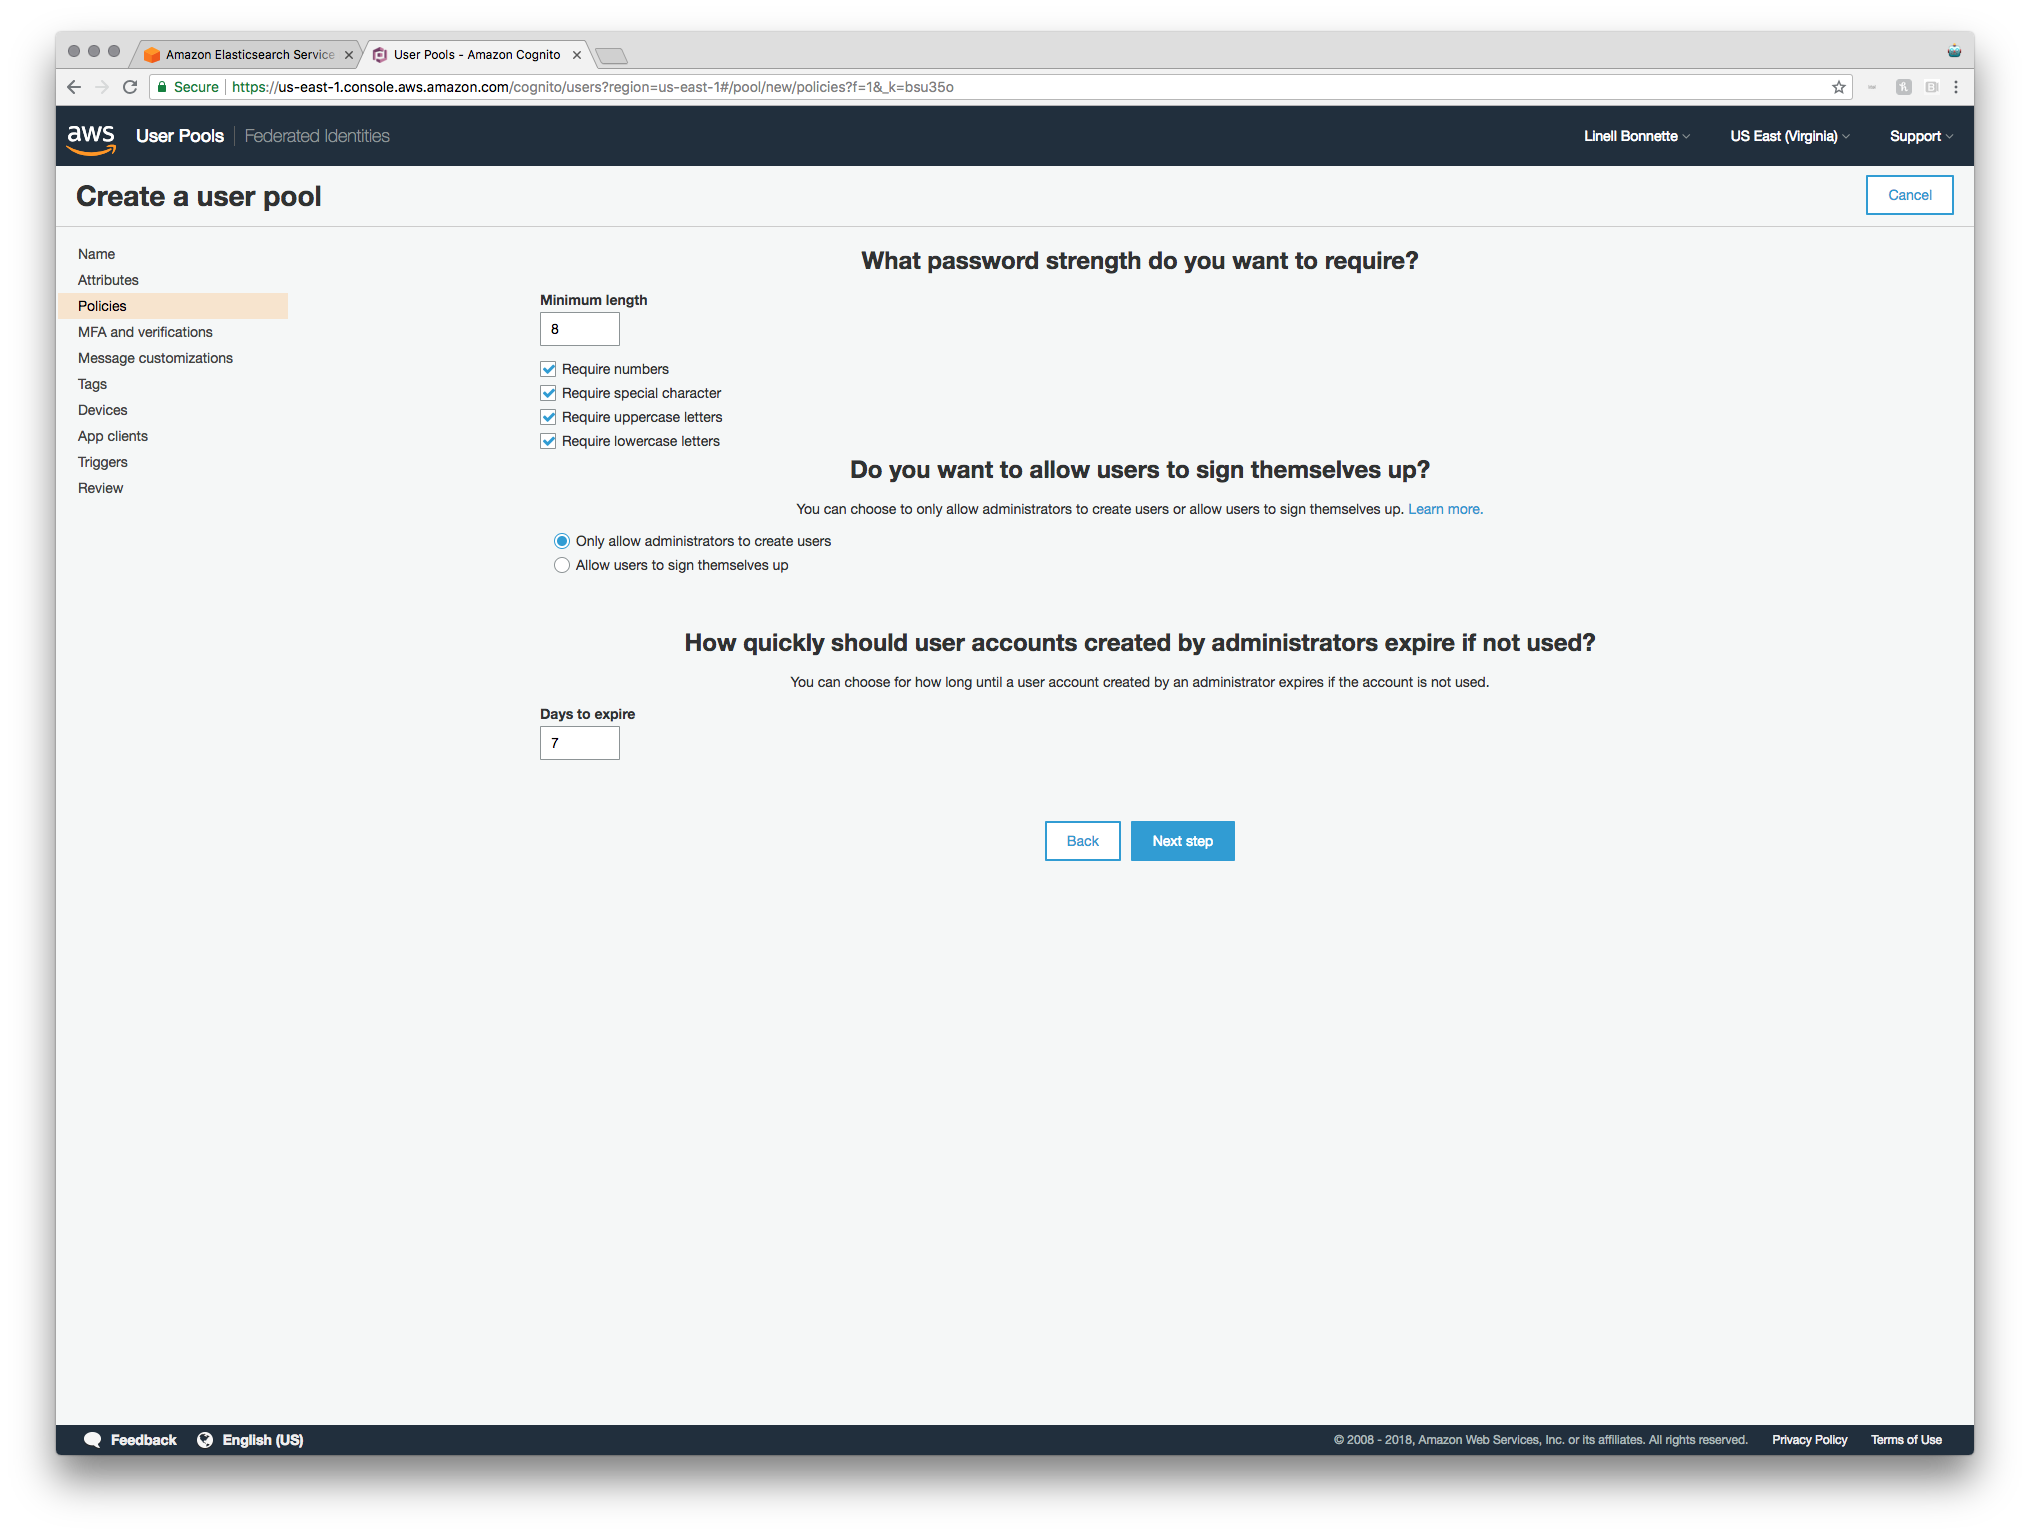
I think that the default password requirements are fine for my use case, so those stay unchanged. I definitely don't want users signing themselves up right now though, so that gets changed to "Only allow administrators to create users". Finally, I don't care that much about how quickly an account expires since, in my use case, anyone who is getting an account is going to look pretty quickly (or it'll at least be fun to mess with them for not signing in after they're given the account to look at something) so I'm just leaving it at seven days.
After this step, there's not much more configuration that I need to do in my use case so I just clicked "Next step" until the final screen. You should definitley poke around at all of the super cool options, though! Regardless, when you're done you should go ahead and click "Create pool".
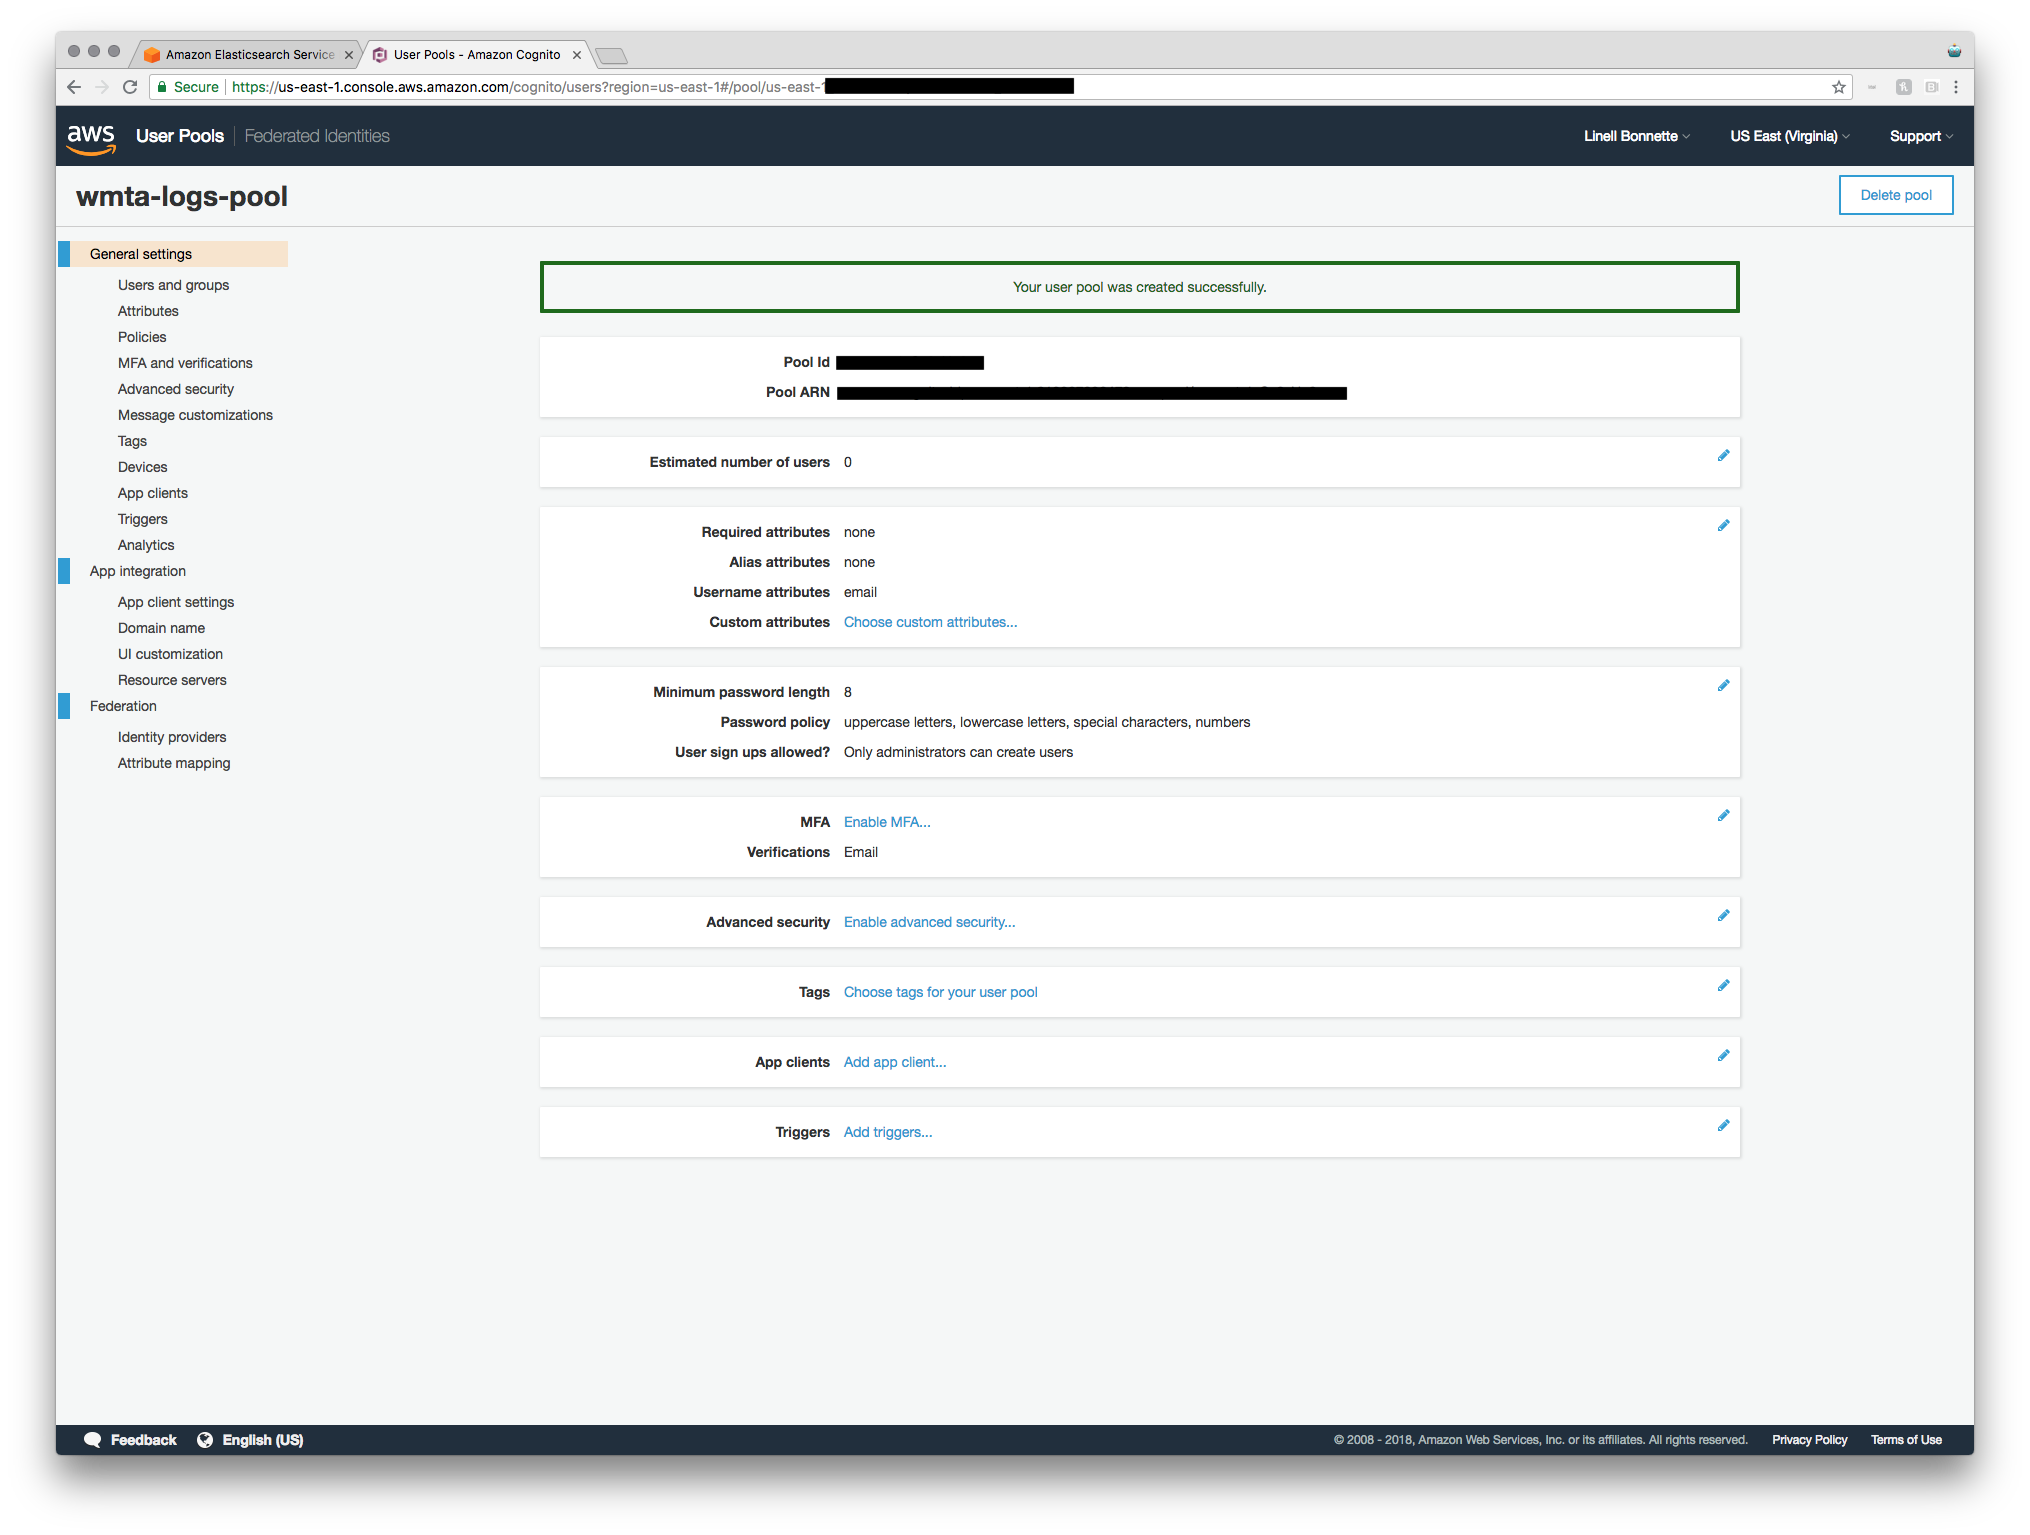
There's one final little thing we've got to do before we move on from user pool creation, though. Click "Domain name" under the "App Integration" category and fill in a domain prefix. Once you've chosen an available one, click "Save changes".
Now head back to the tab in which you're creating your Elasticsearch domain, click the little refresh button underneath the user pool select box (so that your freshly created pool shows up), and then select the new pool.
Now it's time to set up the identity pool, so go ahead and hit "Create new identity pool".
Identity Pool Setup
The first step in the identity pool wizard is simply a name. In keeping with the theme so far, I'm going to get crazy and use WMTA Identity Pool. I absolutely do not want to enable unauthenticated users, but we're going to temporarily check this box so that we're able to go ahead and click "Create Pool". The ElasticSearch wizard takes care of actually setting the authentication providers section up correctly for us (which unchecks this box for you later). Once you've created the pool, you're guided through creating IAM roles for authenticated and unauthenticated identities. Don't worry too much about these for now -- just click "Allow".
Once you're done creating the pool, let's head back to the Elasticsearch tab, refresh our options, and then select the pool that you just created.
Access Policy
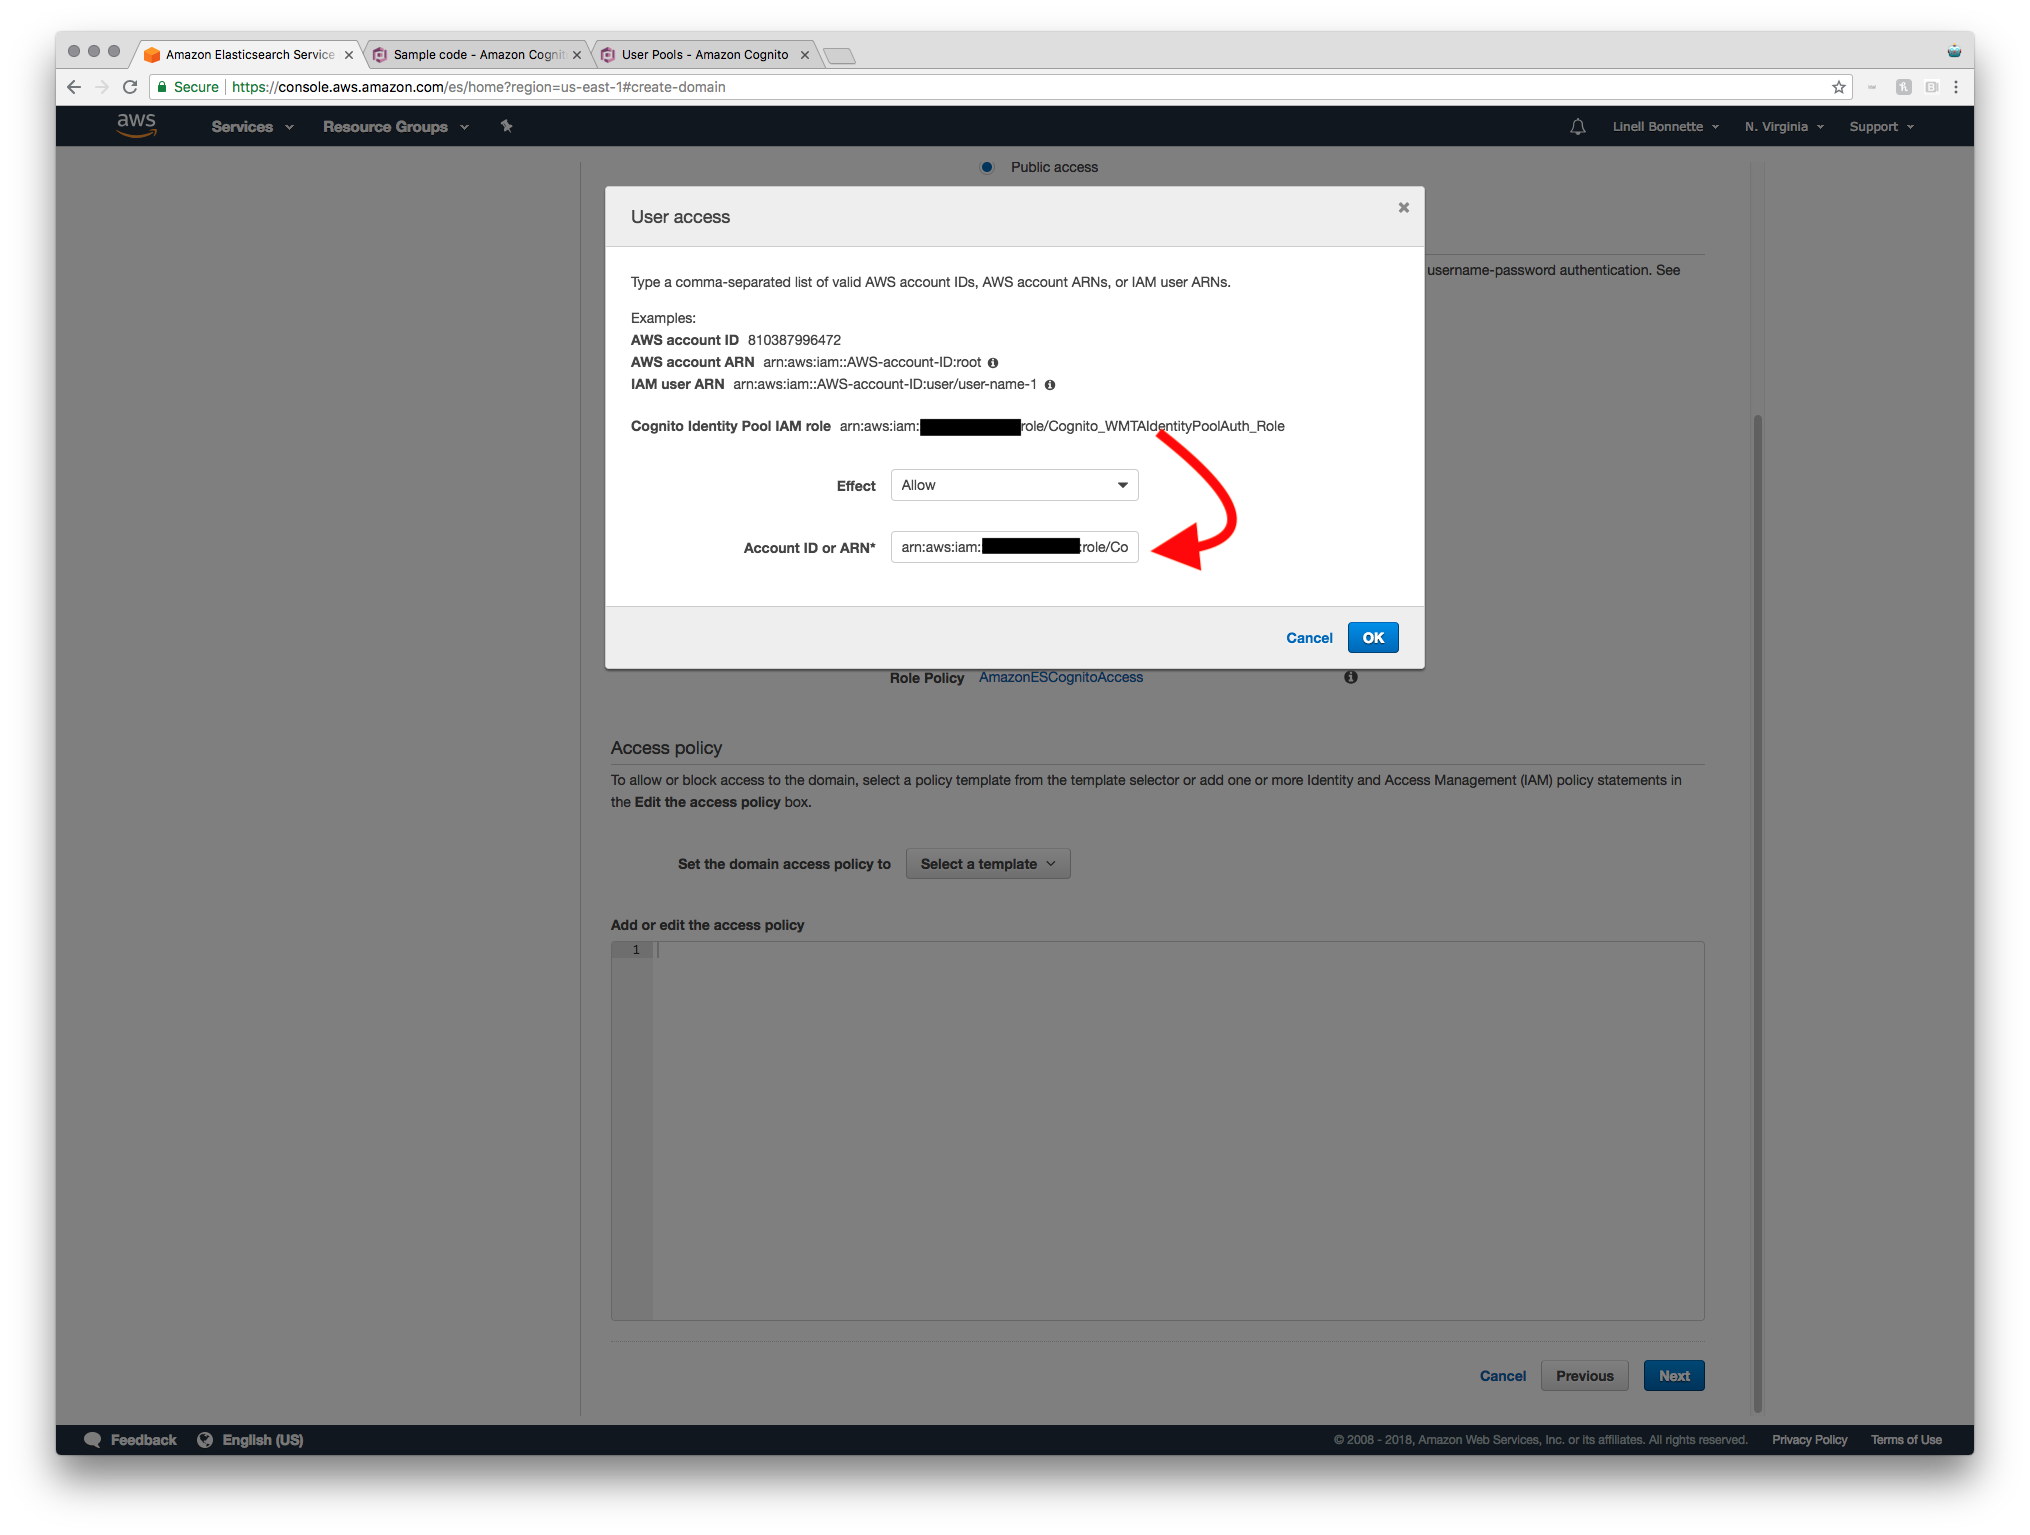
Going back to my specific use case, I only want employees who have been invited to the service to be able to log access the service. To accomplish this, it's as easy as selecting the "Allow or deny access to one or more AWS accounts or IAM users" template. When you do this, it even helpfully gives you your Cognito Identity Pool IAM role, which is exactly what you're going to want to copy paste into the "Account ID or ARN" input.
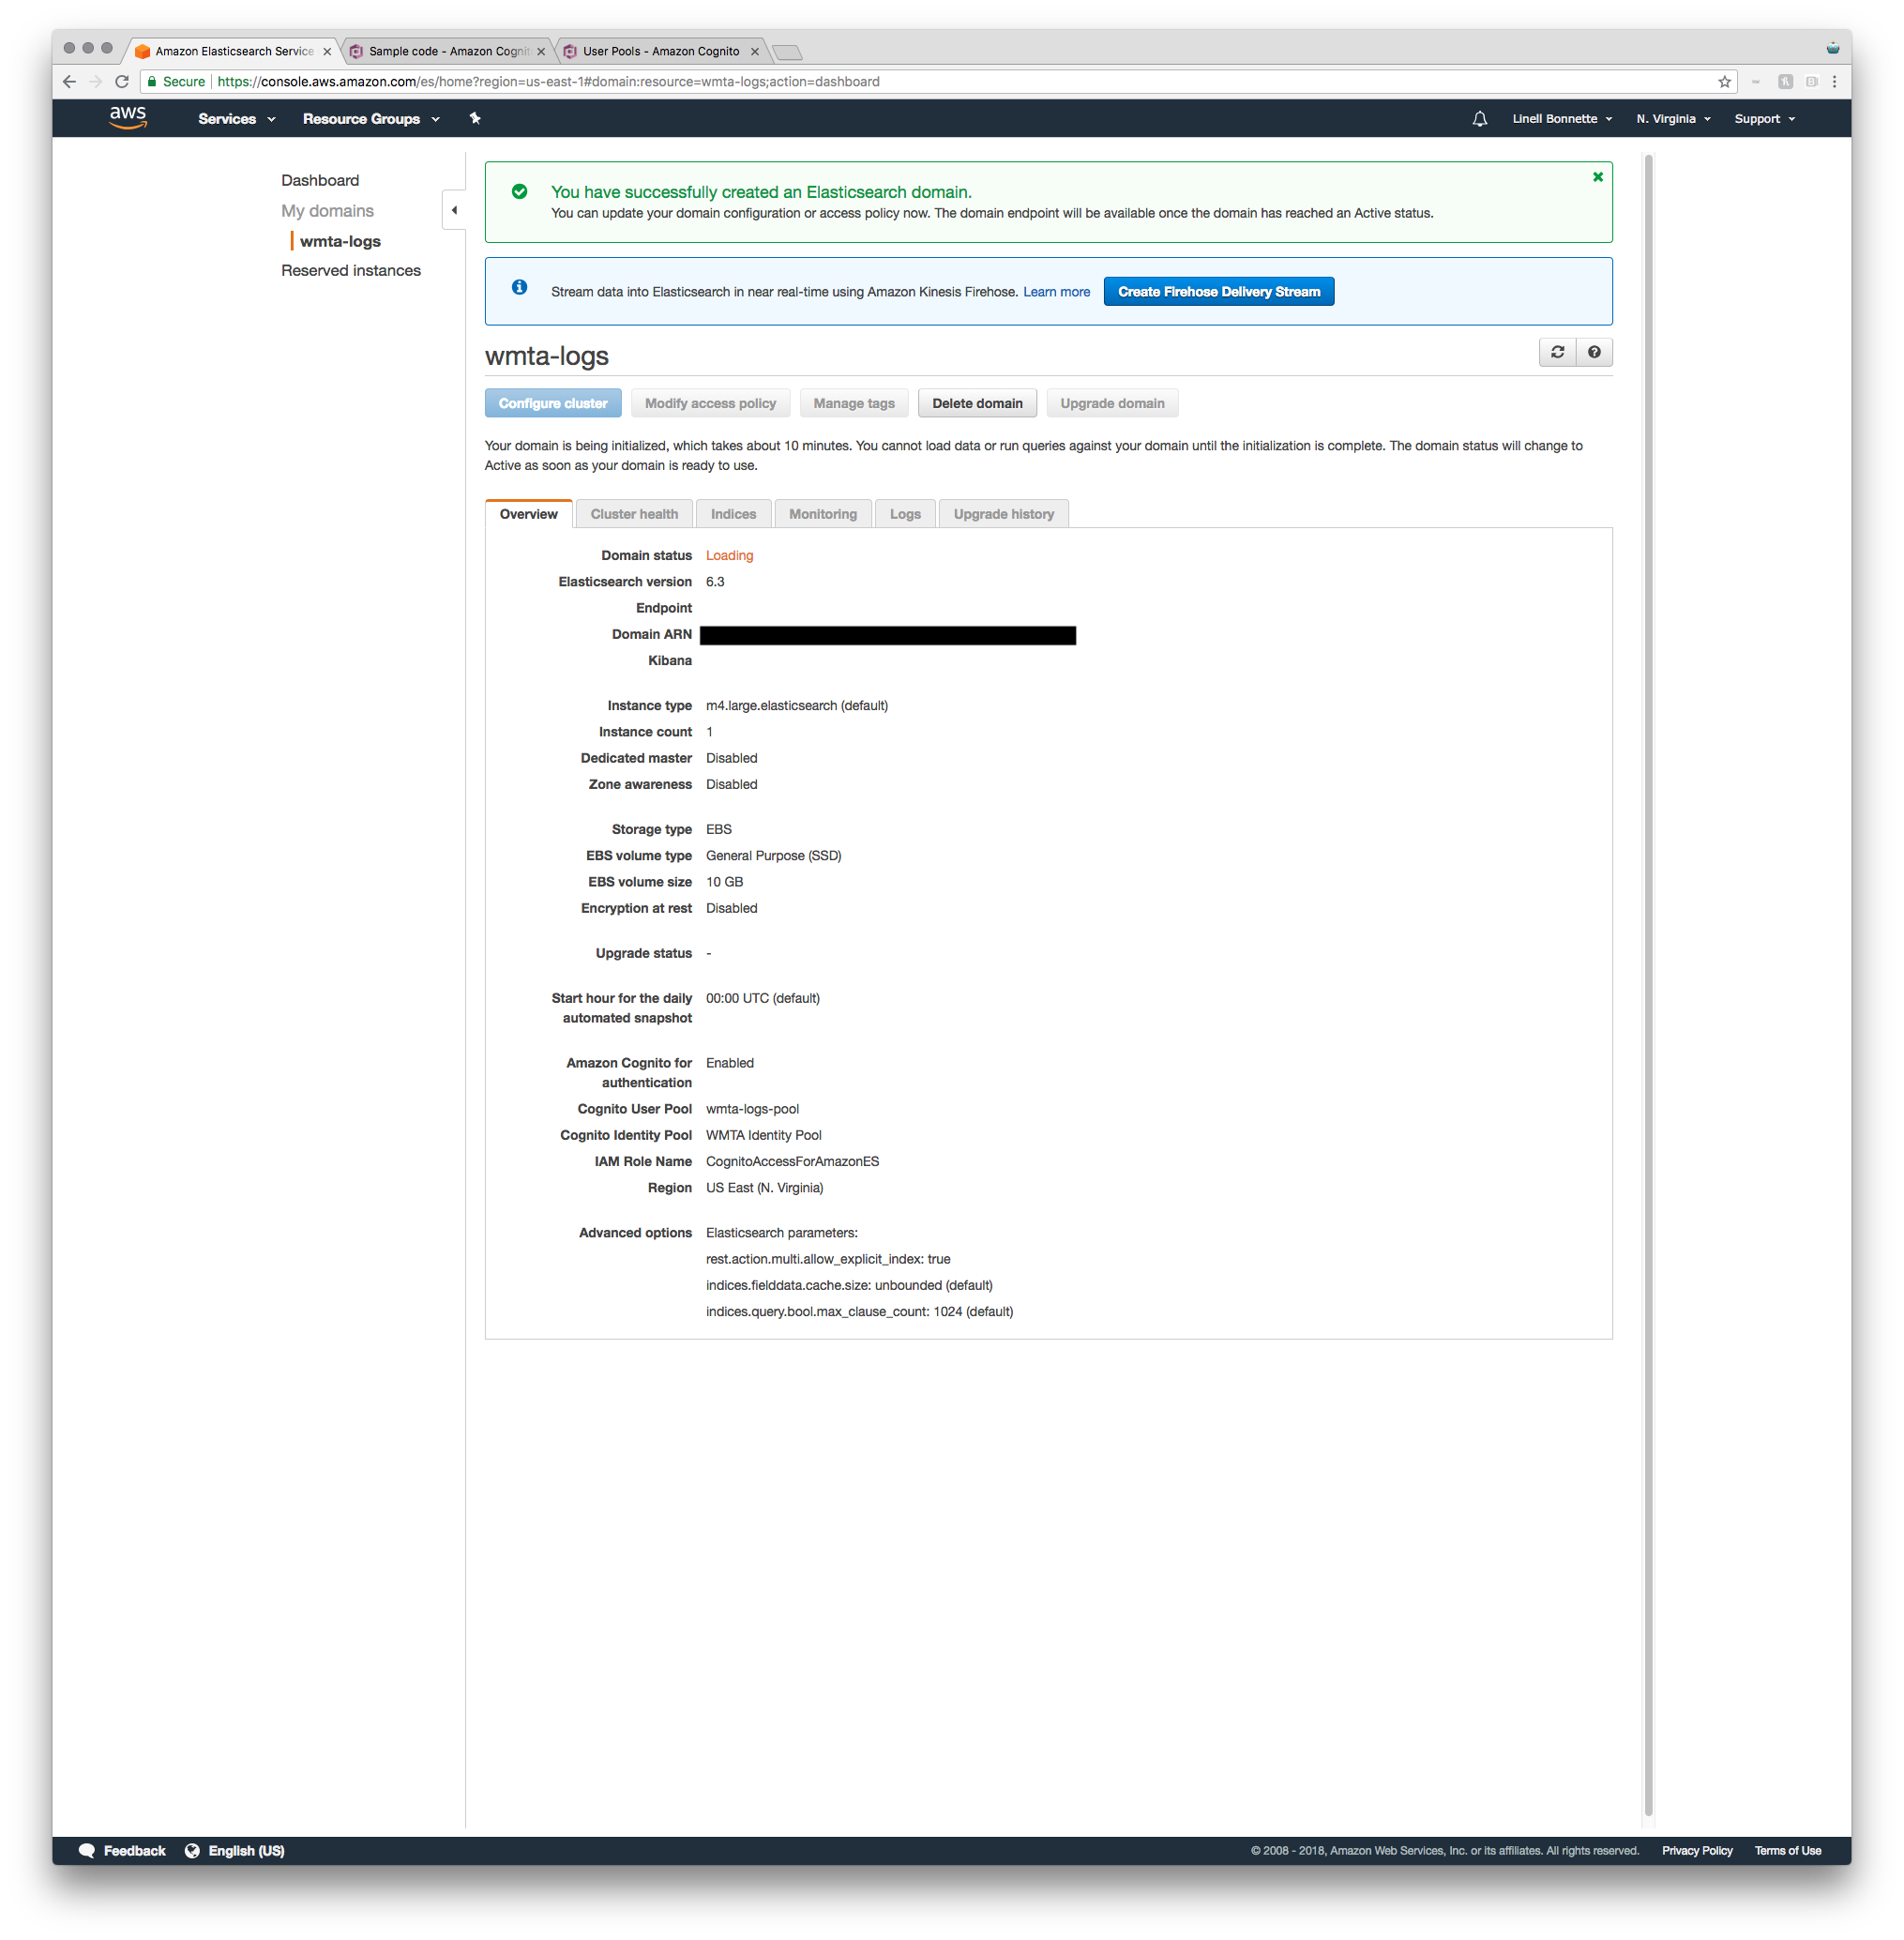
When you're done setting up the access policy and click next, you're taken to the review screen for your Elasticsearch domain. Verify that everything looks good and then hit the confirm button.
It'll likely take your domain a few minutes to completely spin up. You can keep track of this by watching the domain status property displayed in the overview and refreshing every now and again.
CloudWatch
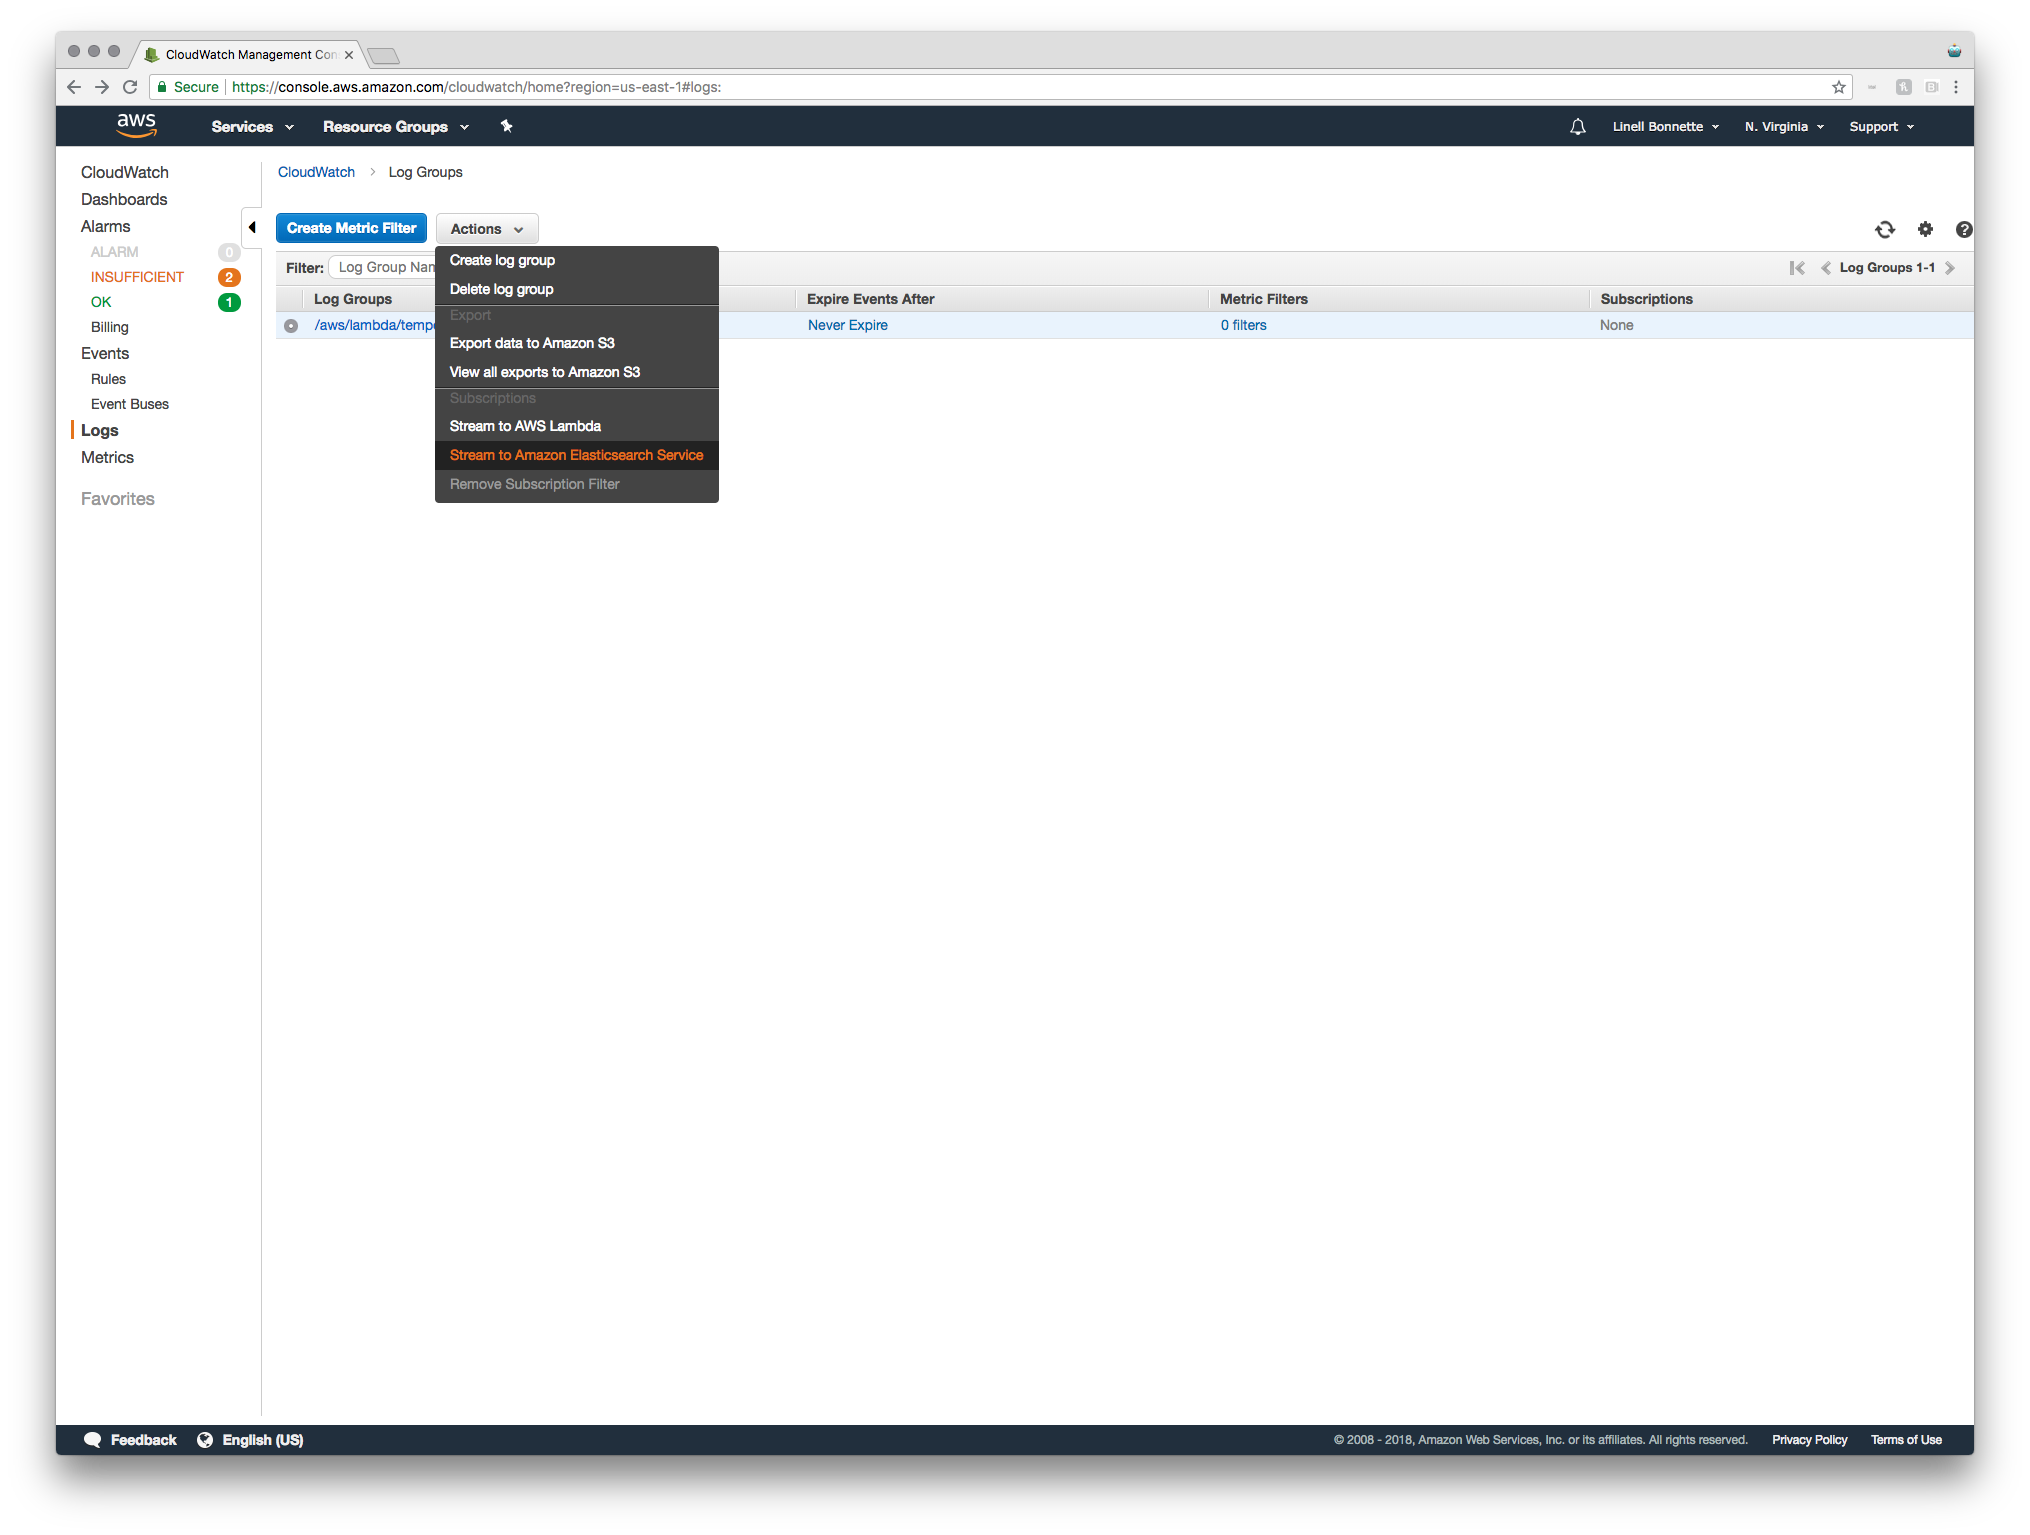
Now that we've got an Elasticsearch Domain to stream our data to, we need to actually set up the streaming data! To do this, just hop into CloudWatch and navigate to the "Logs" category. Select the stream you'll be logging and, in the "Actions" dropdown, select "Stream to Amazon Elasticsearch Service".
We'll be streaming to our own account and to our newly created ES cluster. The only remaining item in step one is to select a Lambda IAM Execution role. If you've got one that you want to use that's fine - it just has to have permissions to make calls to Amazon ES. If you don't already have one, just select "Create new IAM role". In the resulting tab you can rename it and view the policy that it will be creating. I'm fine with the defaults, so I'm just clicking "Allow" on this screen, and then hitting "Next" to move on to step two of the streaming setup.
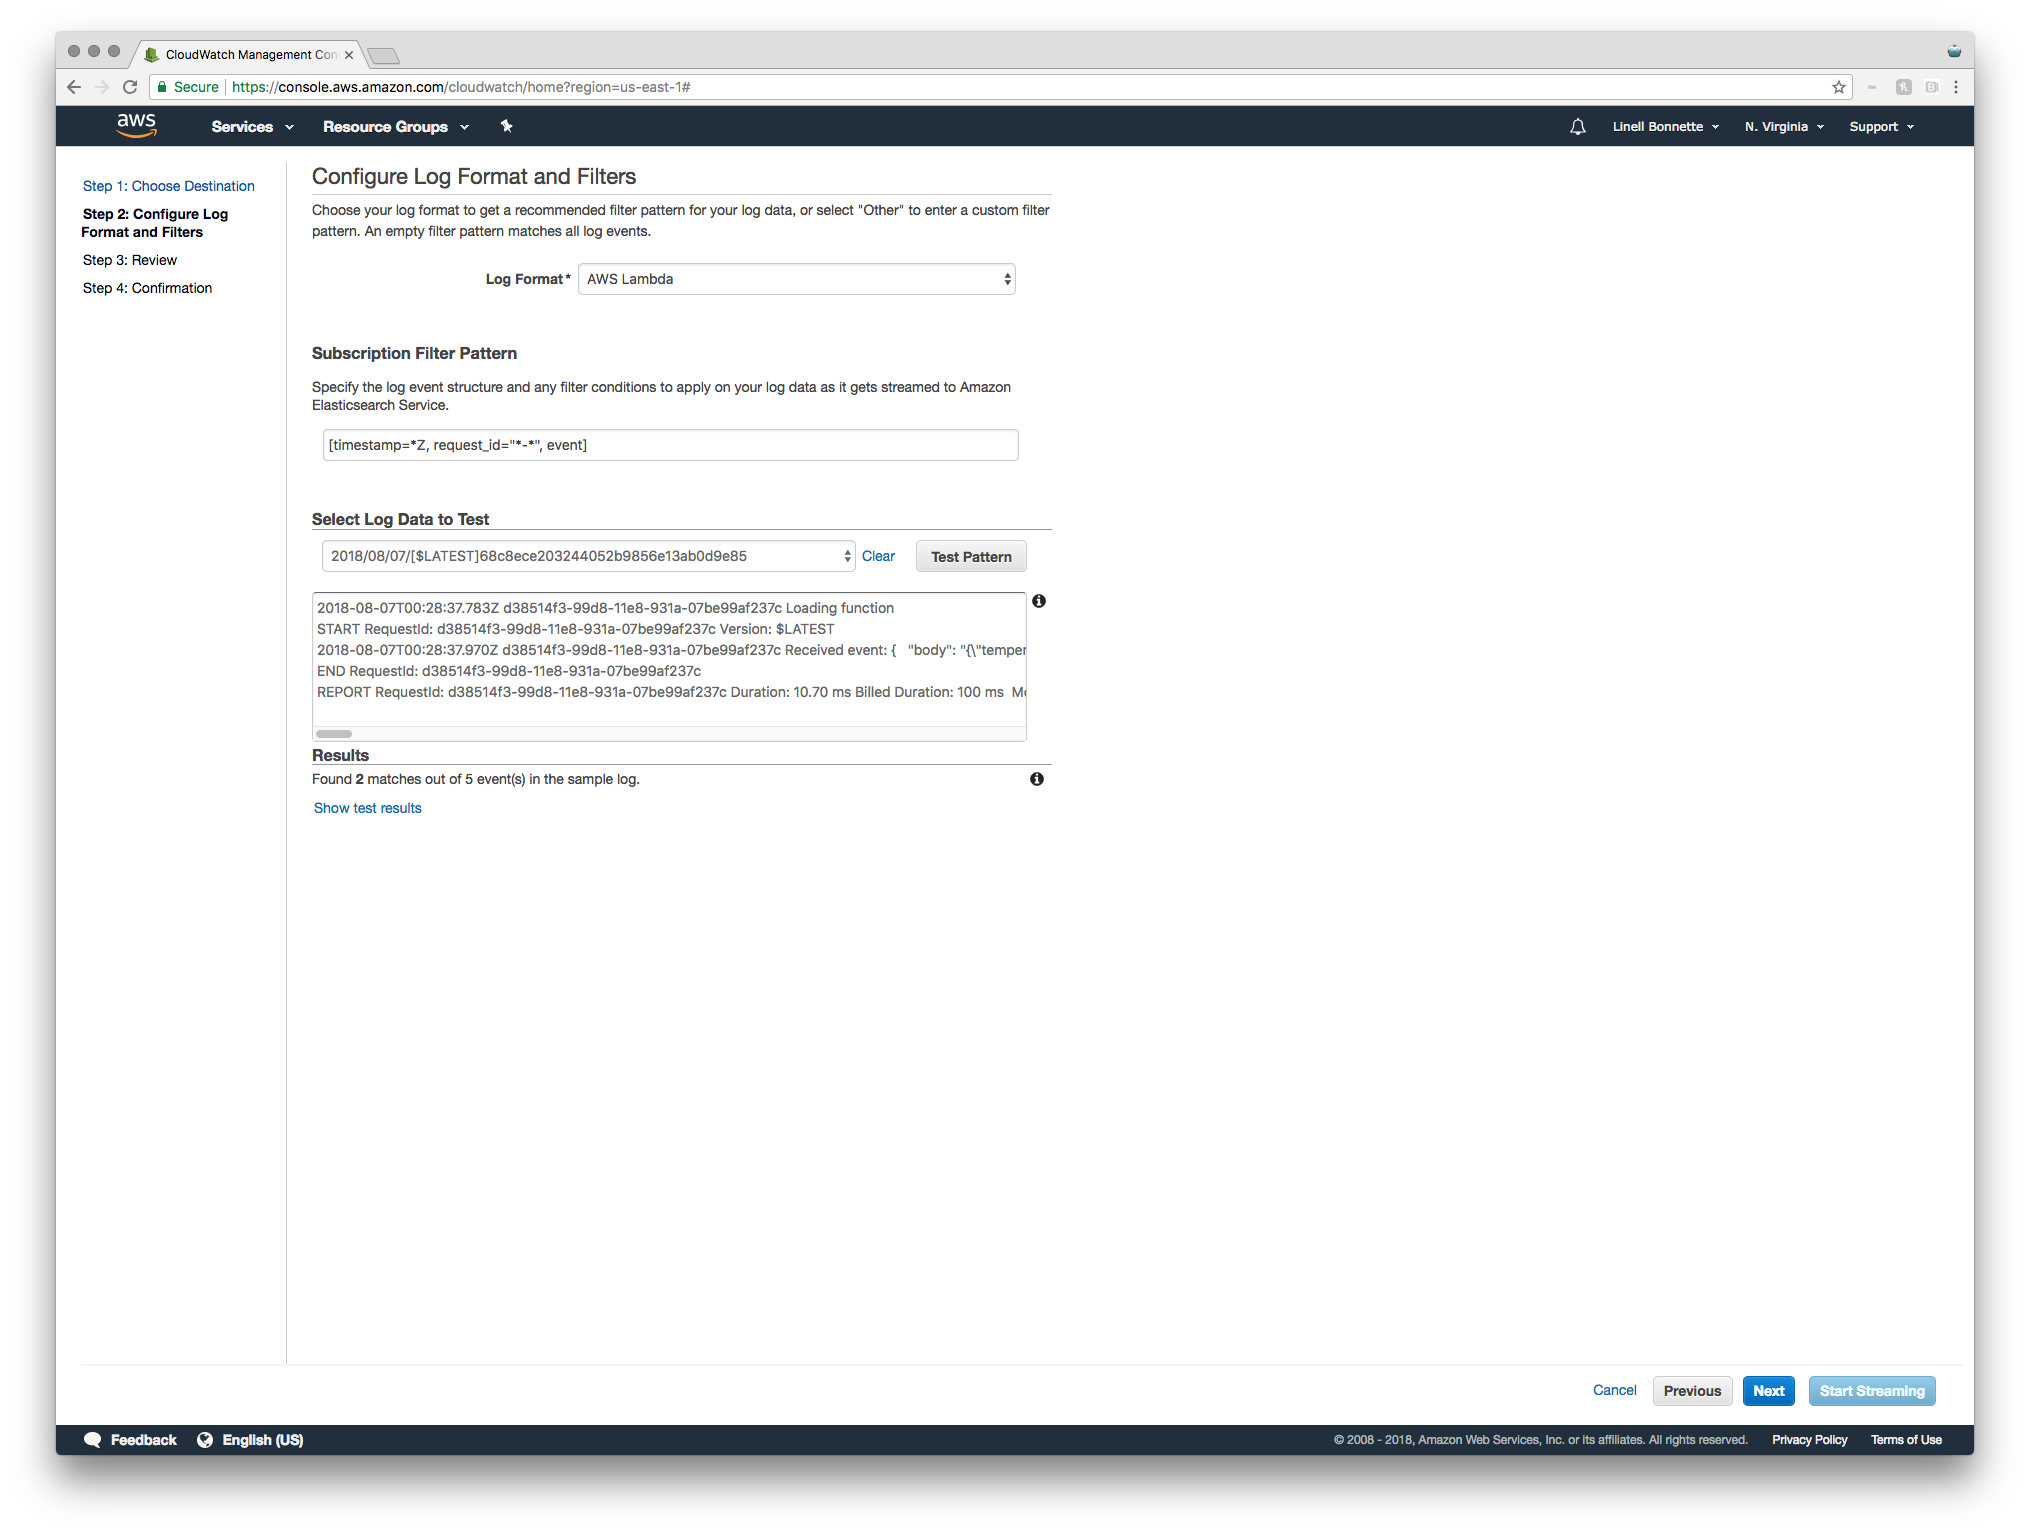
The next step is to configure the log format and filters. This step was, for the service that sparked my interest in doing this at all, a huge pain. The log format didn't quite match up to what was expected and it took a fair amount of trial and error to figure it out. In this example though, since the service in question is just a Lambda function, I'm just going to select "AWS Lambda" as the log format and then use their defaults. If you run into the same problem that I did where things just don't work like you'd expect, feel free to reach out to me for help. It's not really hard to figure out, just sort of painful.
From here all you've got to do is review some settings and click next until you've got your logs streaming! Once you're done, navigate back over to the Elasticsearch Service dashboard and click on your domain, and then click the Kibana URL. You should be presented with a login screen. That's good news, though -- it means that we set up the authentication requirements correctly!
To create a user, you just go back to the User Pools section of the Cognito dashboard, and select your user pool. From here, click "Users and groups" and then click "Create user".
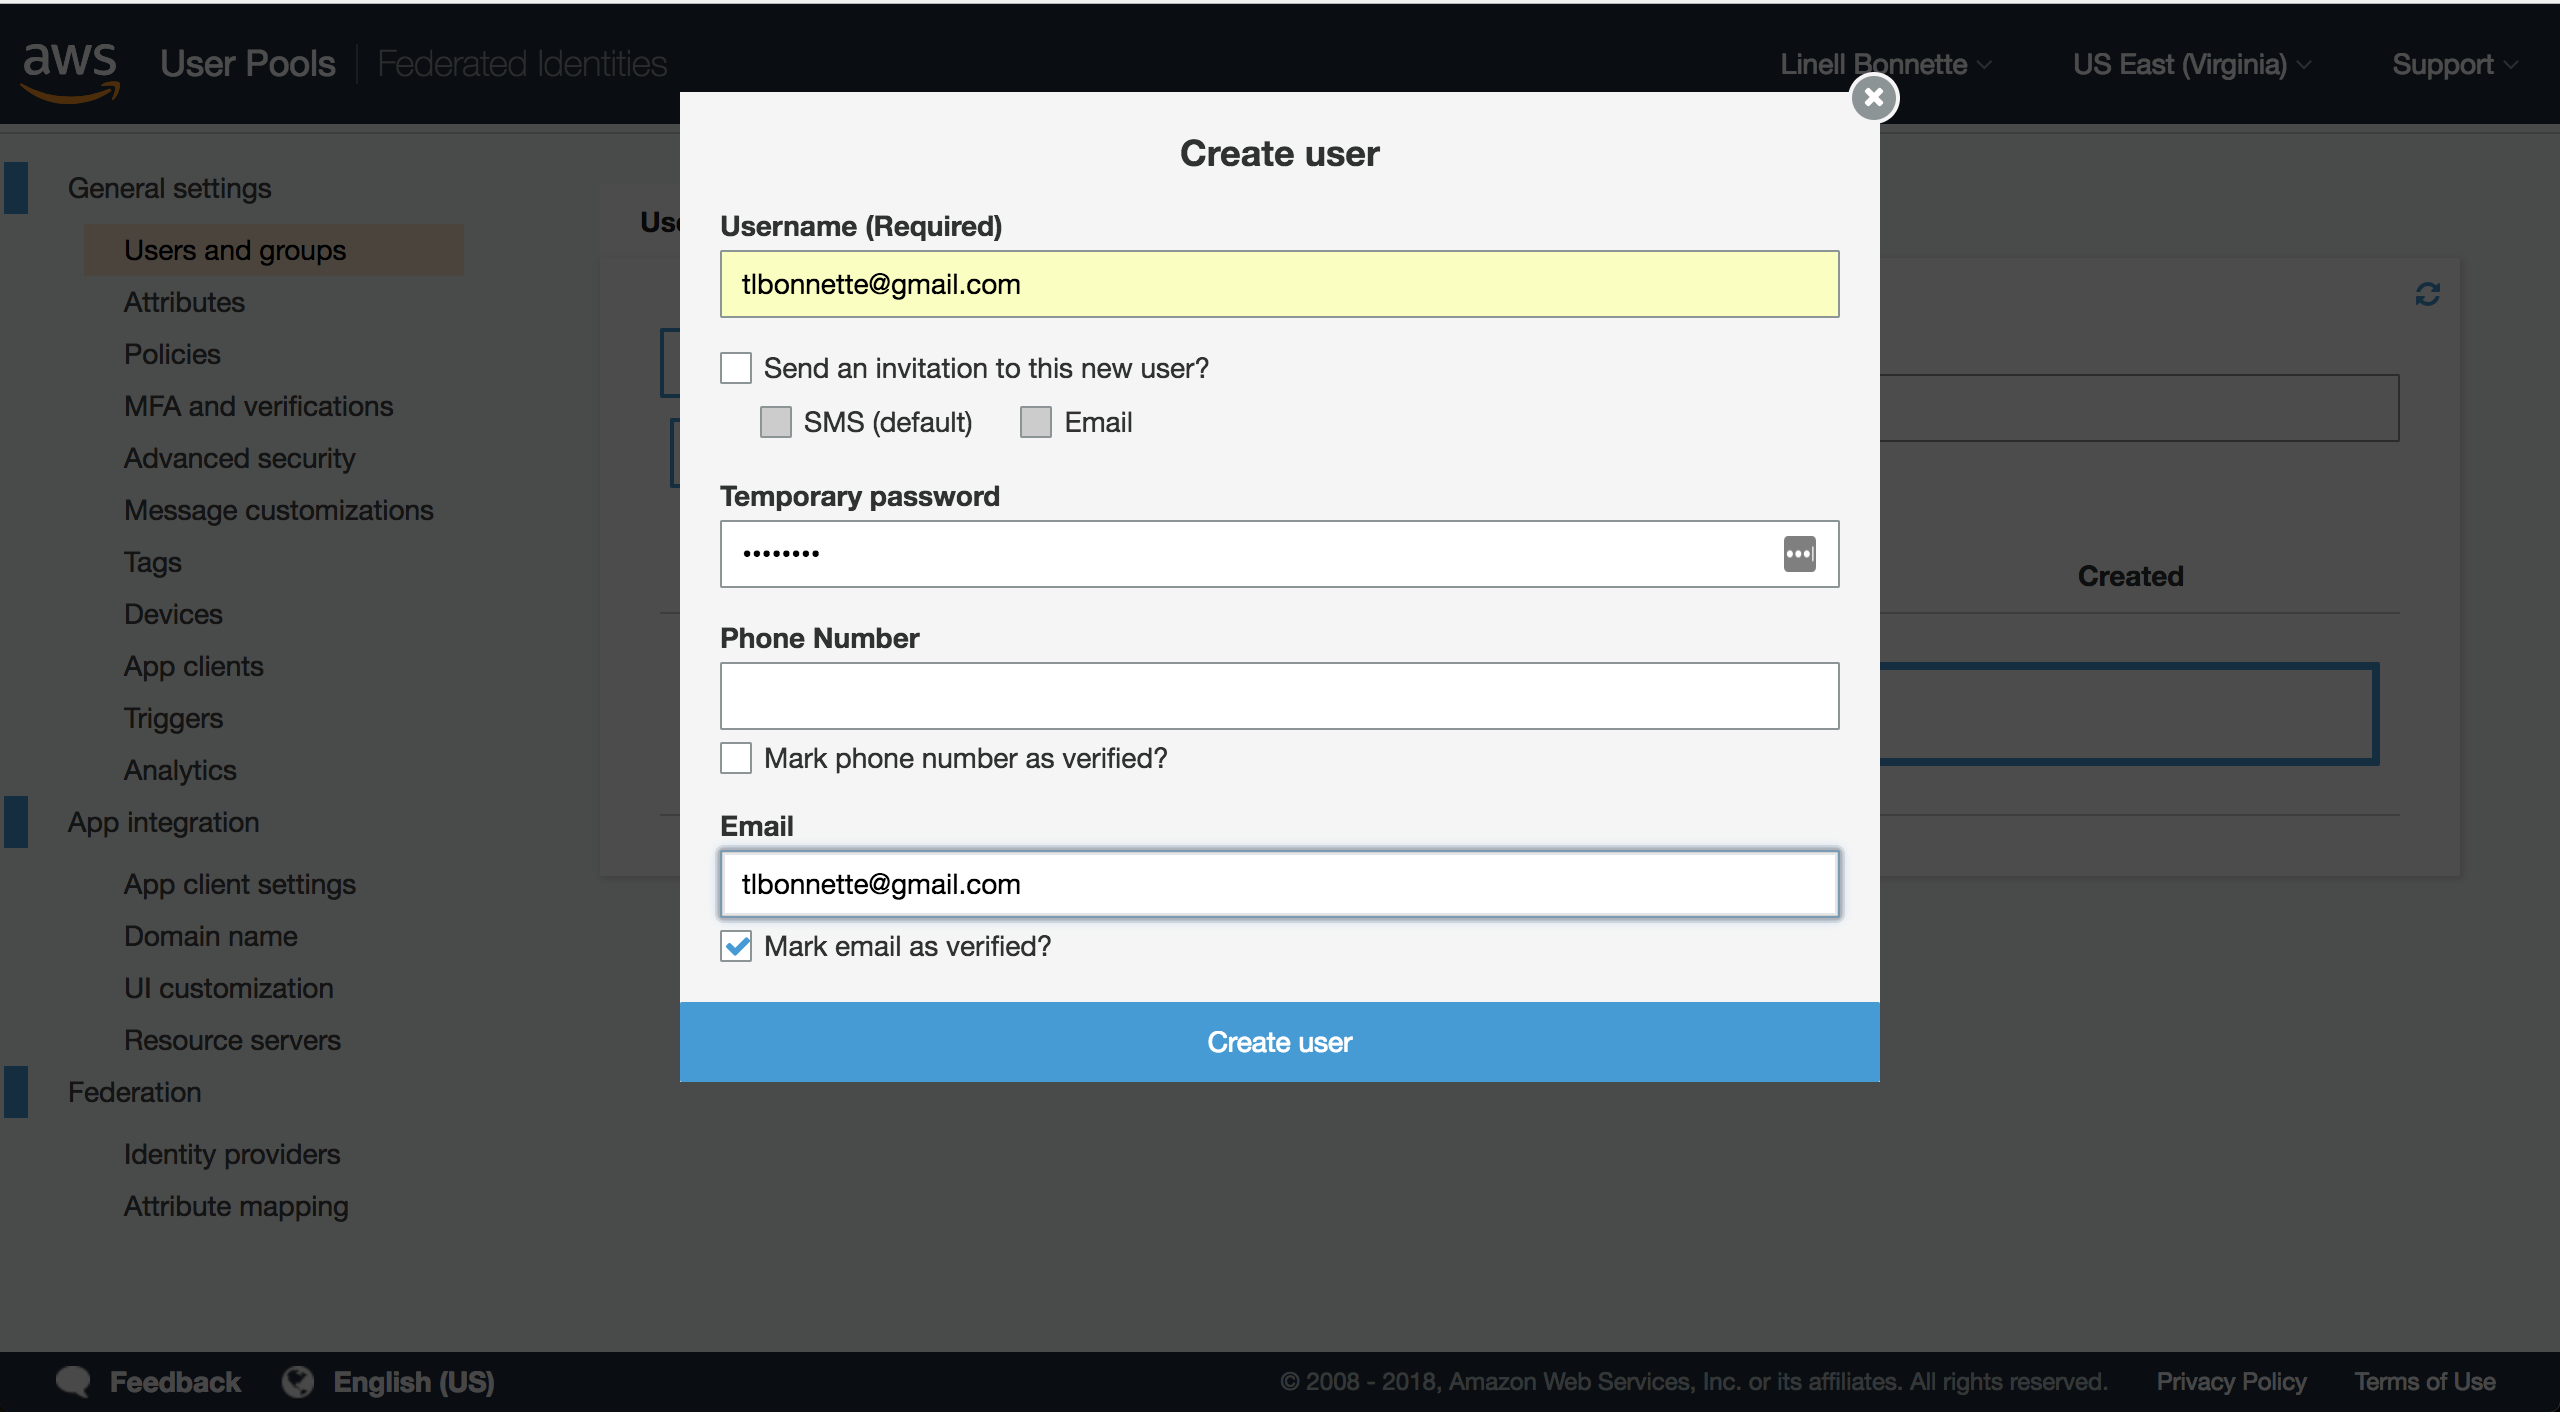
Once you've filled out your information and created the user, head back to the Kibana URL and sign in. You should be presented with a nice, shiny interface. The first thing you're going to want to do is head to the "Management" section and create an index pattern. The index pattern you want to use is cwl-* (which, when typed in, should give you a success message for matching an index). In the next screen you'll want to set your Time Filter field name, which I'm setting to timestamp. Hit create and then navigate over to the "Discover" section. You may need to adjust your timeframe (in the top right), but you should now be seeing data!
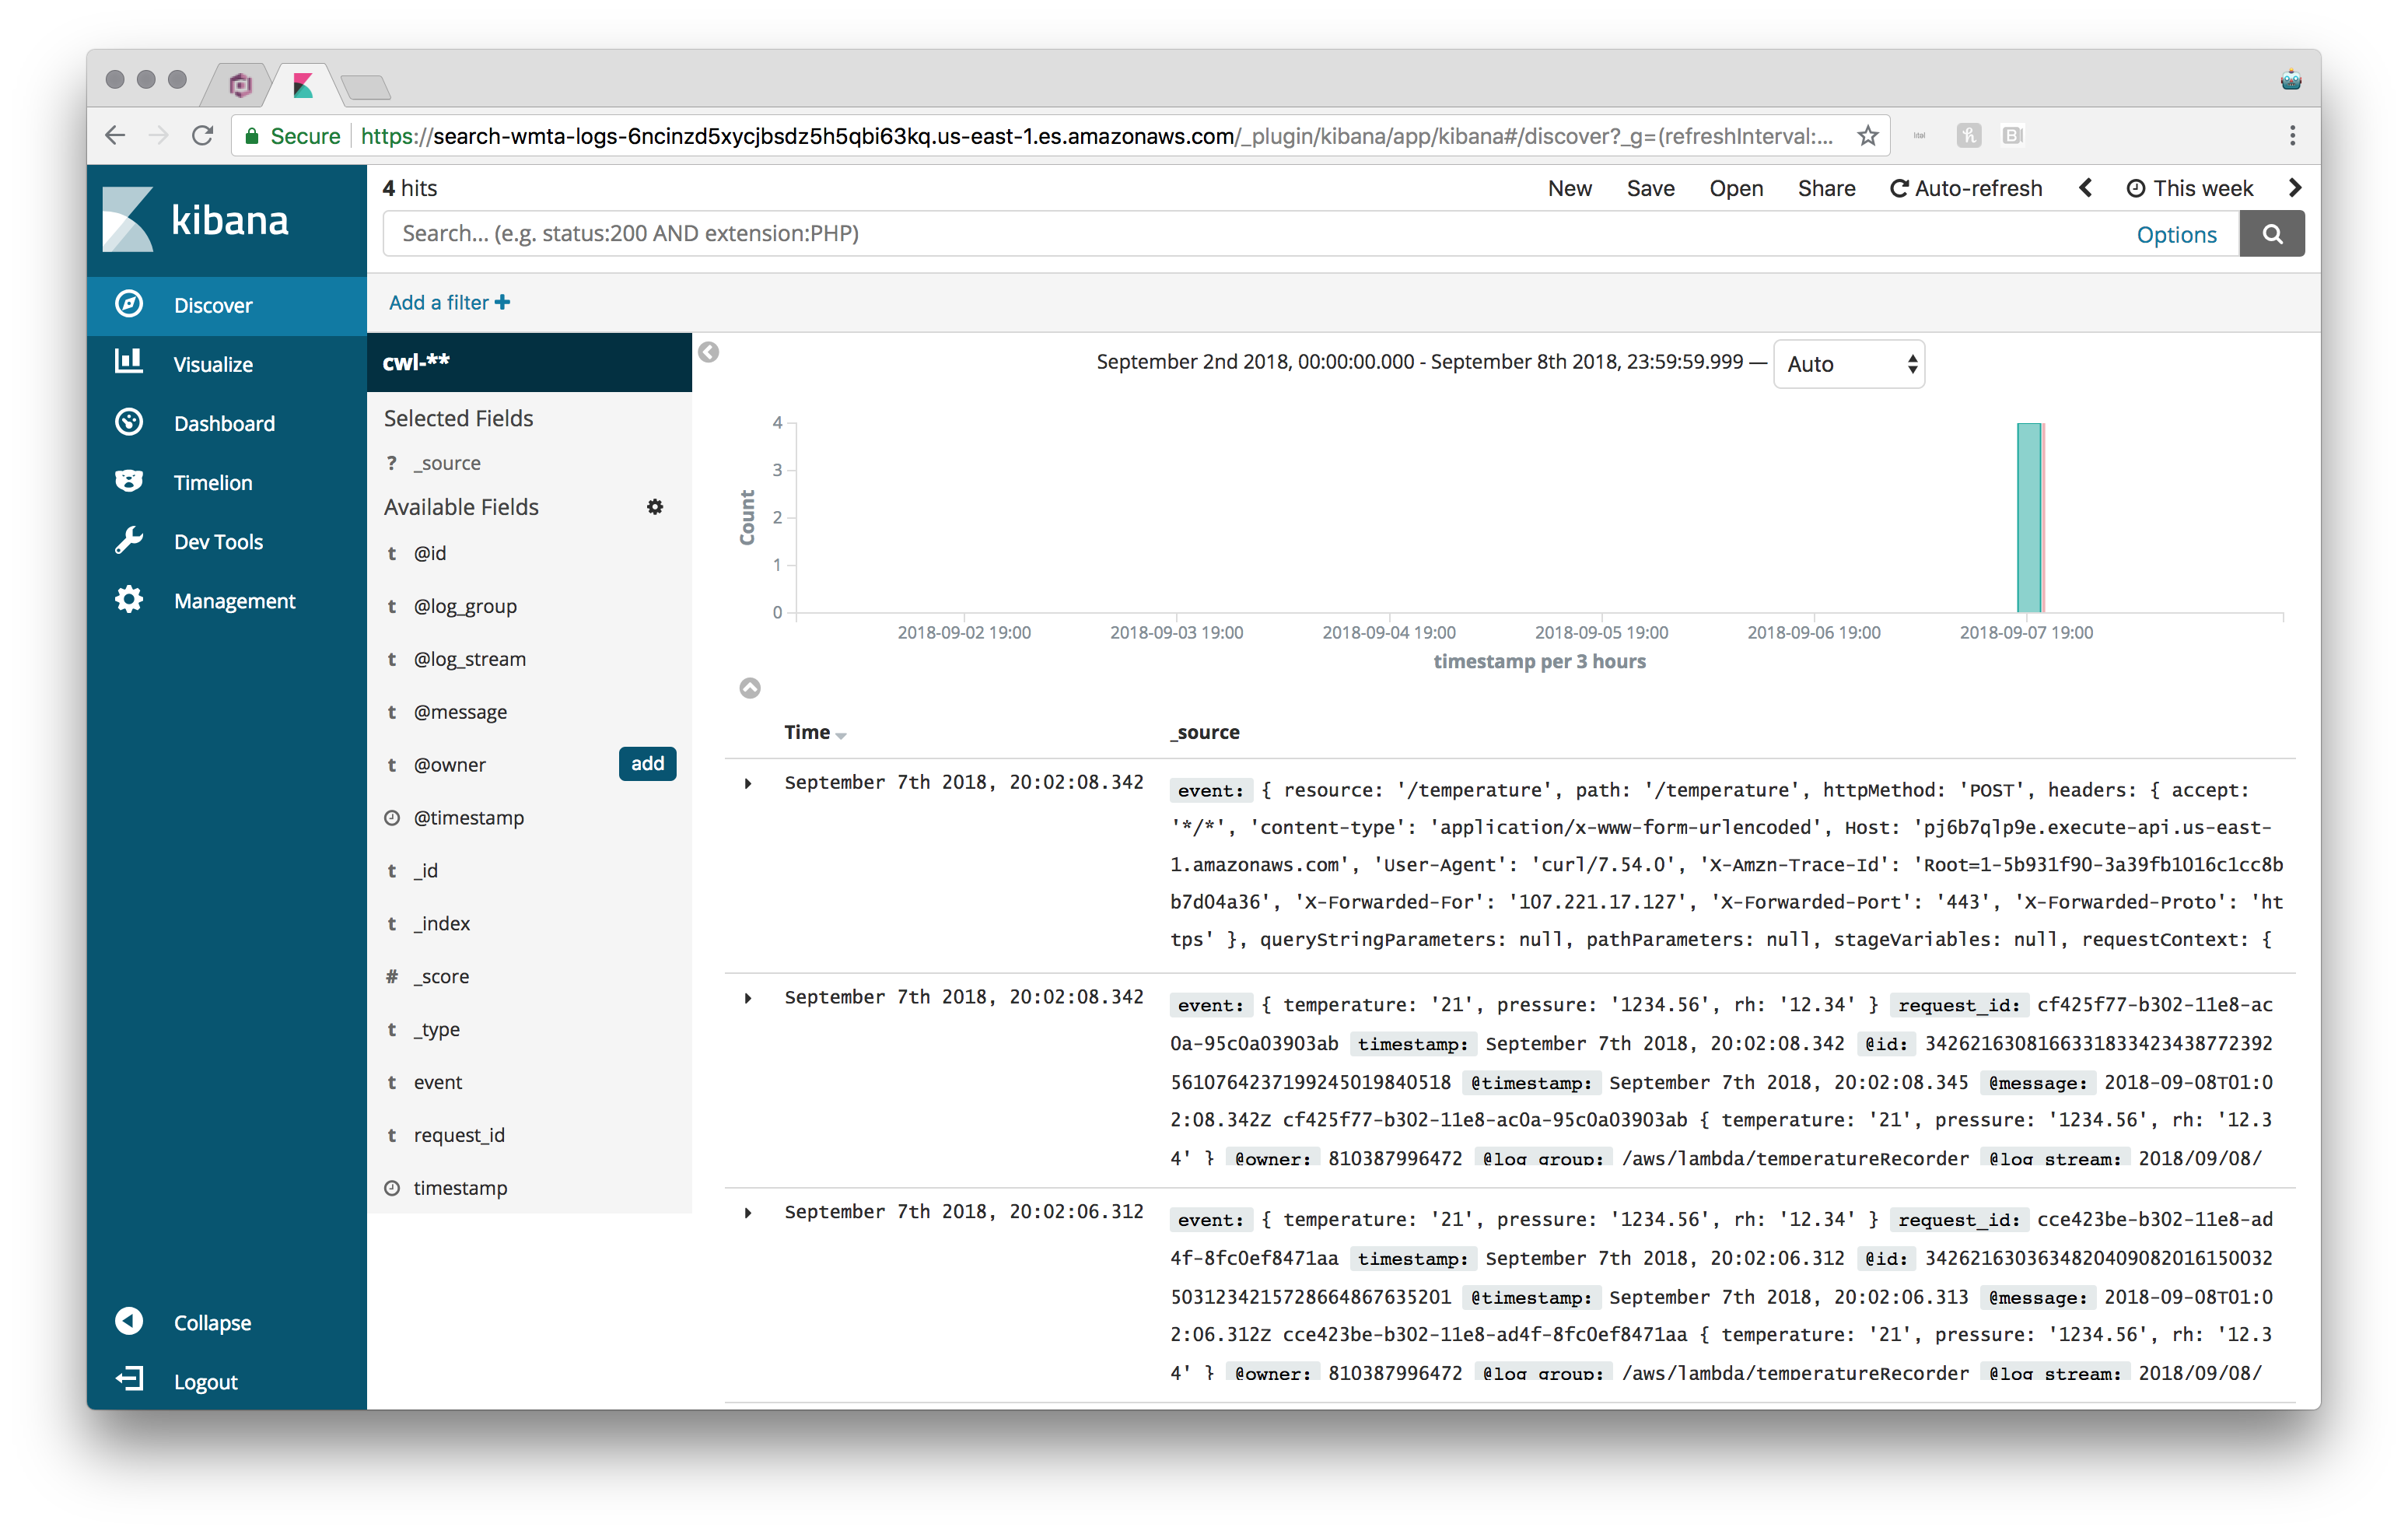
At this point you should be able to do just about anything you want to do in Kibana. If you've got any questions, don't hesitate to reach out!